


- Posts: 2
Simulation AC anual output much smaller than the imported Custom AC Gen. Profile
- André Quites Ordovás Santos
- Topic Author
Less
More
08 Jun 2026 11:17 #14559
by André Quites Ordovás Santos
Simulation AC anual output much smaller than the imported Custom AC Gen. Profile was created by André Quites Ordovás Santos
Hi! We are evaluating the use of SAM to complement analysis of PV Systems with BESS, but we are facing some issues with the AC generation.
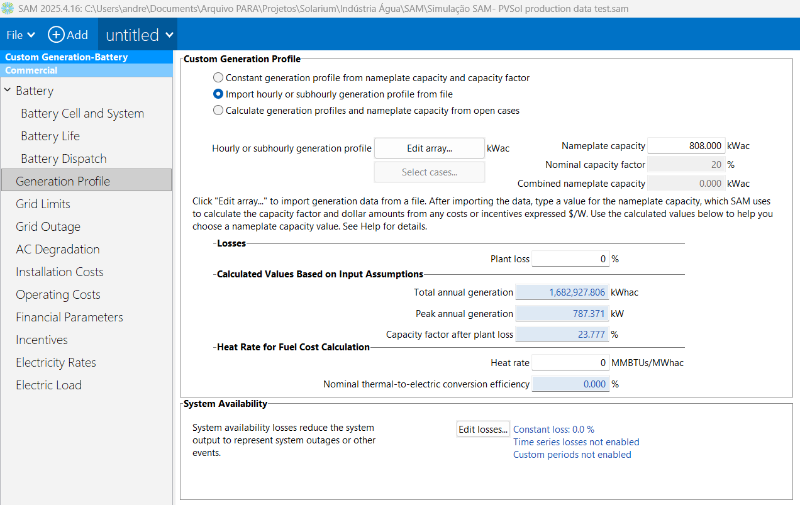
Since we could not find the PV and inverter models we want to simulate in the SAM custom database, we have simulated it in another software, which we already know very well and trust, and then have imported the hourly AC output of the PV System to SAM, in the Custom Generation-Battery page. As you can see in the attached figure 1, SAM have correctly imported it and calculated (correctly) the annual production forecast as
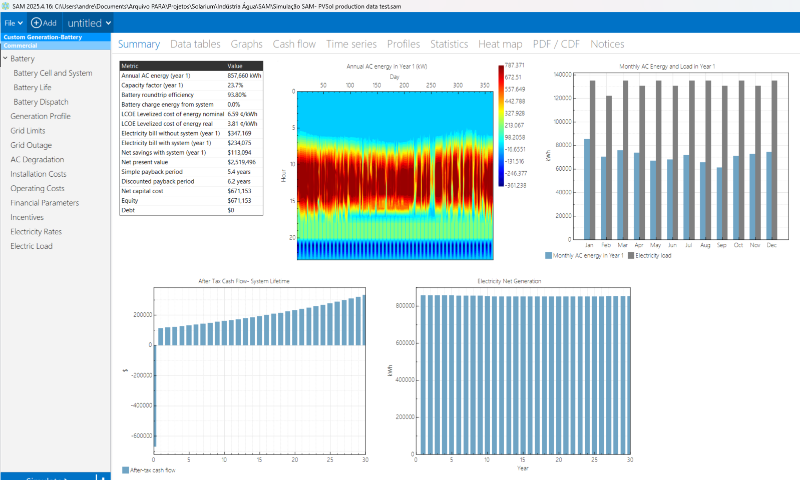
1,682,927.806 kWhac. However, after simulating, in the results metrics table, the first line "Annual AC energy (year 1)" showns a significantly lower value of 857,660 kWh, as you can see in figure 2.
Can someone explain why such divergence? I have already tried to disable all possible losses. What SAM includes in this severe discount? Is it possible to disable it, so as to use the imported generation, which is already the final AC output including losses? If that is not possible, how can I know what kind of losses SAM is calculating, so I can try to compensate in some other way?
Thank you in advance for your help.
Regards,
Eng. Dr. Andre Quites O. Santos
Since we could not find the PV and inverter models we want to simulate in the SAM custom database, we have simulated it in another software, which we already know very well and trust, and then have imported the hourly AC output of the PV System to SAM, in the Custom Generation-Battery page. As you can see in the attached figure 1, SAM have correctly imported it and calculated (correctly) the annual production forecast as
1,682,927.806 kWhac. However, after simulating, in the results metrics table, the first line "Annual AC energy (year 1)" showns a significantly lower value of 857,660 kWh, as you can see in figure 2.
Can someone explain why such divergence? I have already tried to disable all possible losses. What SAM includes in this severe discount? Is it possible to disable it, so as to use the imported generation, which is already the final AC output including losses? If that is not possible, how can I know what kind of losses SAM is calculating, so I can try to compensate in some other way?
Thank you in advance for your help.
Regards,
Eng. Dr. Andre Quites O. Santos
Please Log in or Create an account to join the conversation.
- Paul Gilman
Less
More
- Posts: 5741
09 Jun 2026 09:41 #14560
by Paul Gilman
Replied by Paul Gilman on topic Simulation AC anual output much smaller than the imported Custom AC Gen. Profile
Hi Andre,
The "Annual AC energy (year 1)" value in the Metrics table on the Summary tab of the Results page accounts for energy to charge and discharge the battery. It is the sum of the time series "System power generated (kW)" over Year 1, and is equivalent to "Energy to grid net (kWh)" in the Energy section of the cash flow (on the Cash Flow tab of the Results page).
System power generated is the power at the grid interconnection point. For a system with batteries, during time steps when the battery is charging, system power generated is the power generated by the system minus battery charge power. When the battery is discharging, system power generated is power generated by the system plus battery charge power.
You can see how this works by comparing your generation profile with the following time series outputs (you can display them on the Data Tables tab of the Results page):
Paul.
The "Annual AC energy (year 1)" value in the Metrics table on the Summary tab of the Results page accounts for energy to charge and discharge the battery. It is the sum of the time series "System power generated (kW)" over Year 1, and is equivalent to "Energy to grid net (kWh)" in the Energy section of the cash flow (on the Cash Flow tab of the Results page).
System power generated is the power at the grid interconnection point. For a system with batteries, during time steps when the battery is charging, system power generated is the power generated by the system minus battery charge power. When the battery is discharging, system power generated is power generated by the system plus battery charge power.
You can see how this works by comparing your generation profile with the following time series outputs (you can display them on the Data Tables tab of the Results page):
- System power generated (kW)
- Electricity to/from battery AC (kW)
- Electricity to/from grid AC (kW)
Paul.
Please Log in or Create an account to join the conversation.
Moderators: Paul Gilman